The VolLevels™ Algo
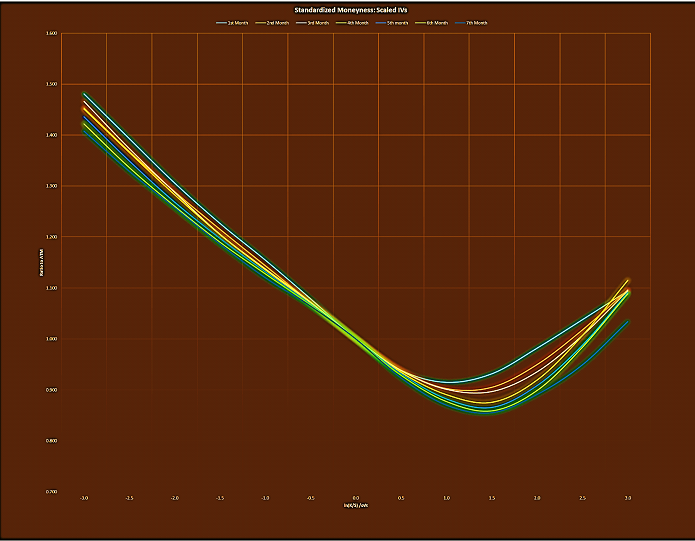
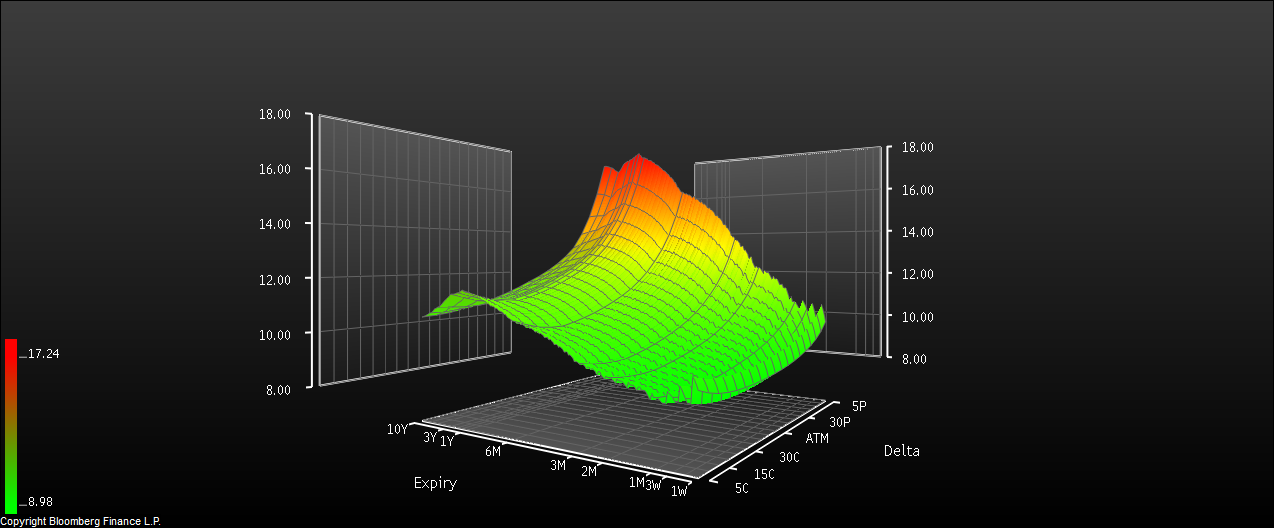
“View and dissect the IV surface from different perspectives, all essential in identifying relative value opportunities.”
The VolLevels™ Algo
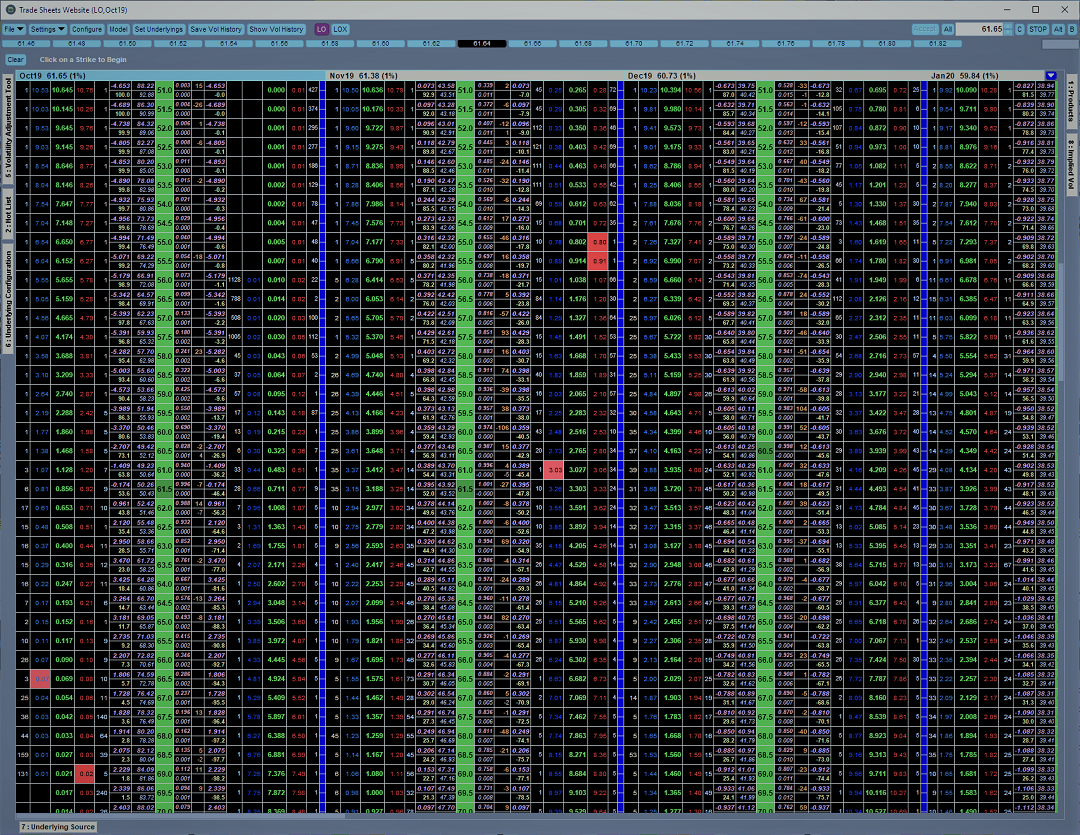
- Provides live, real-time, essential IV market data crucial for spotting relative value, mean reverting, and macro-driven opportunities prevalent in the behavior of implied volatility (IV) and the implied volatility surface.
-
Records and saves user-defined benchmark implied volatility curves, which provide crucial reference points for IV and/or ATM equivalent tick changes in your current live or static IV curves.
Automatically stores and saves an “End of Day” (“EOD”) set of vol curves to employ as a benchmark reference for current and future generated curves.
A separate “Baseline” recording allows the user to utilize a second set of vol curves to reference from, allowing for multiple user-defined “fair value”, median, or reversion-to-the-mean sets of IV curves. - Easy-to-read grids display user-defined expirations separately and chronologically, with delta/strike/sigma points running sequentially on one column.
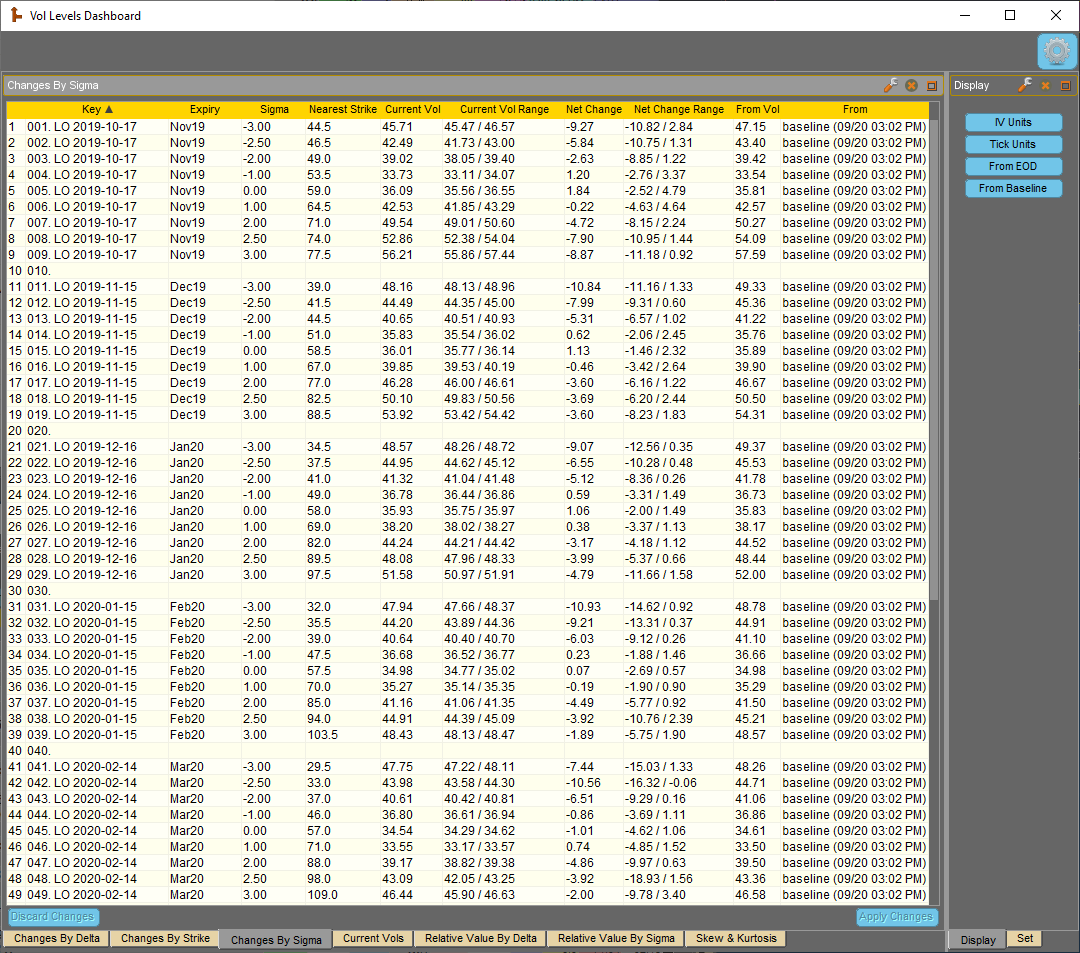
- Calculates the raw IV difference (in percent % terms) between the current IV and the corresponding recorded “Baseline” or “EOD” IV for each user defined delta, strike, and sigma point. Also tracks the raw IV “Net Change Range” throughout the trading session.
- Measures the ATM-equivalent “Tick Unit” differential between the user-defined delta, strike, or sigma points of the current IV curves, and the corresponding delta/strike/sigma points of the recorded “Baseline” or “EOD” IV curves. Also tracks the ATM “Tick Units” “Net Change Range” throughout the trading session.
- Allows the user to conveniently toggle between “IV Units” and ATM “Tick Units” in the “Net Change” and “Net Change Range” column.
- Precisely determines the ATM-equivalent “Tick Units”: a uniquely derived normalizing measuring tool which accurately assesses the magnitude of change (in tick terms) for each delta, strike, or sigma point.
“Trade with clarity, conviction, and confidence.”
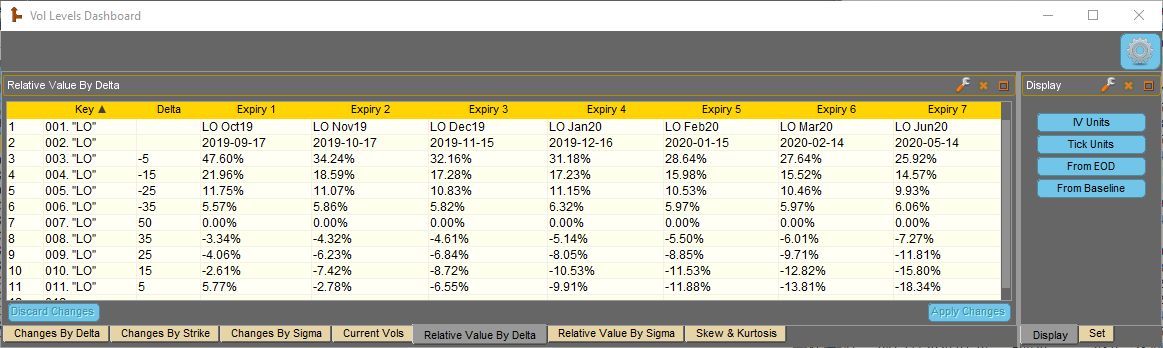
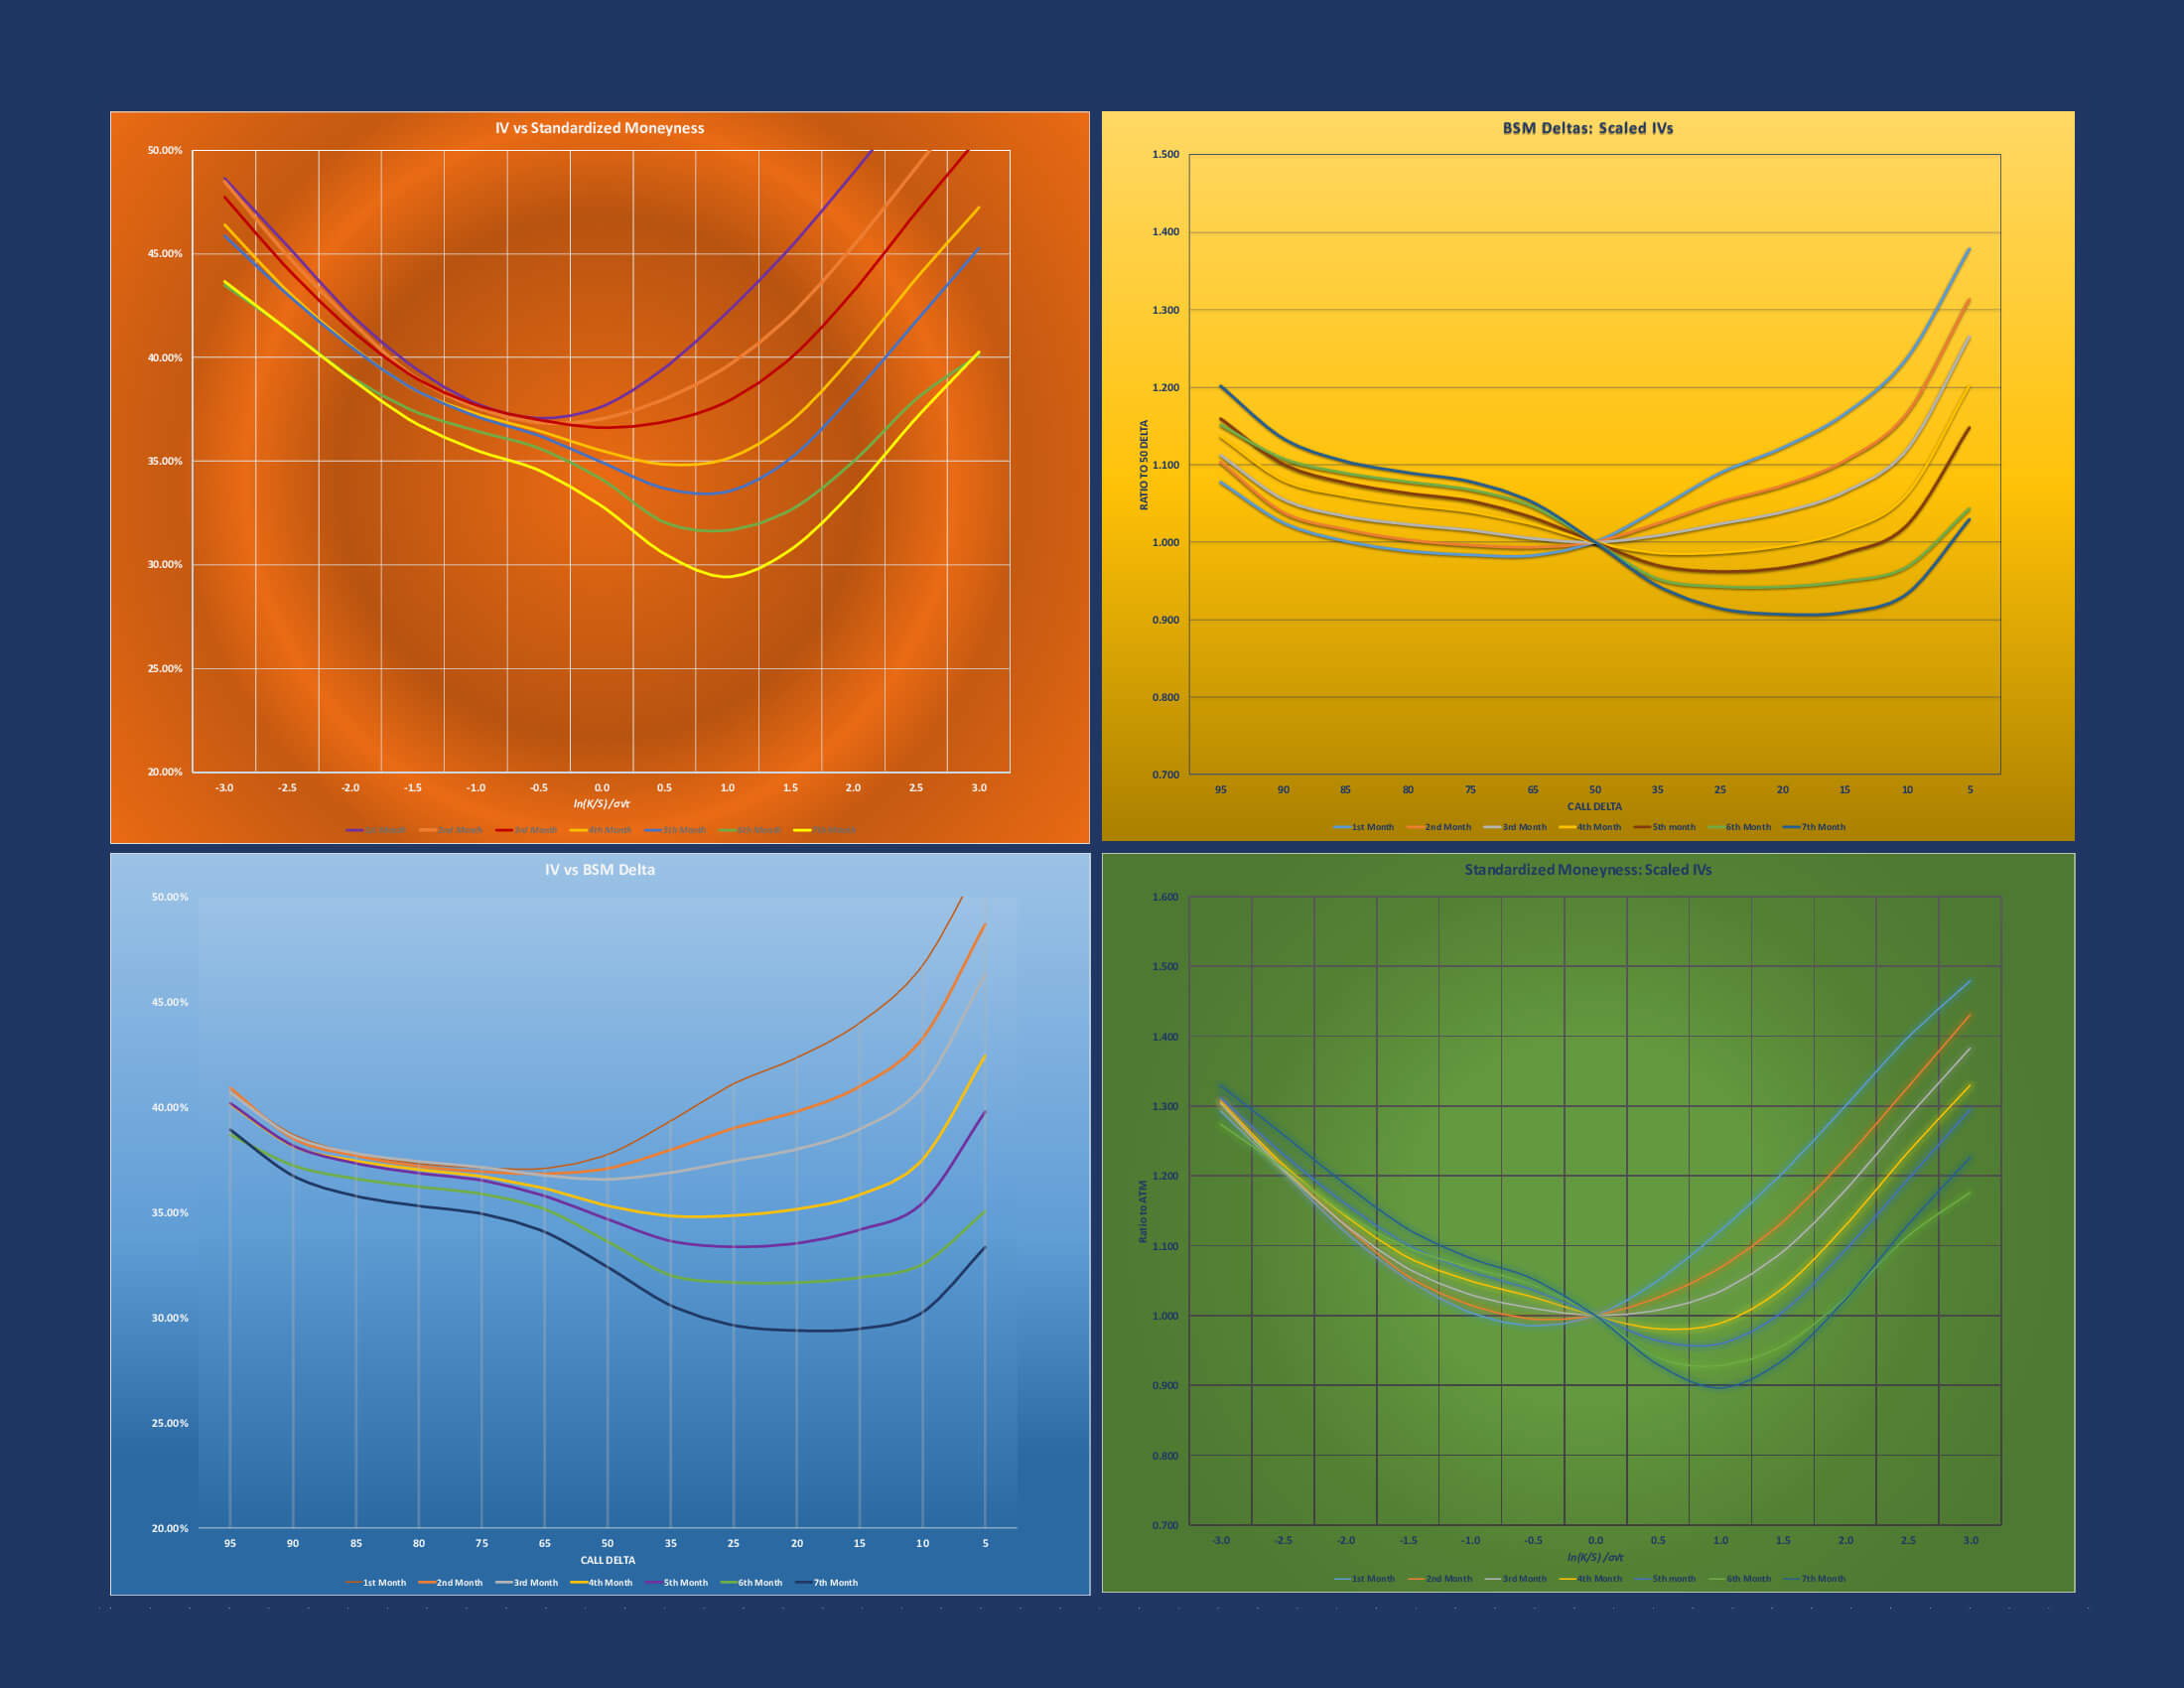
- “Relative Value by Delta/Sigma” grids display scaled IV ratios, expressed as a percentage % premium or discount to the 50 delta and ATM point, respectively. IV ratios allow the trader to compare 2 or more distinct but similar products with substantially different levels of ATM IV.
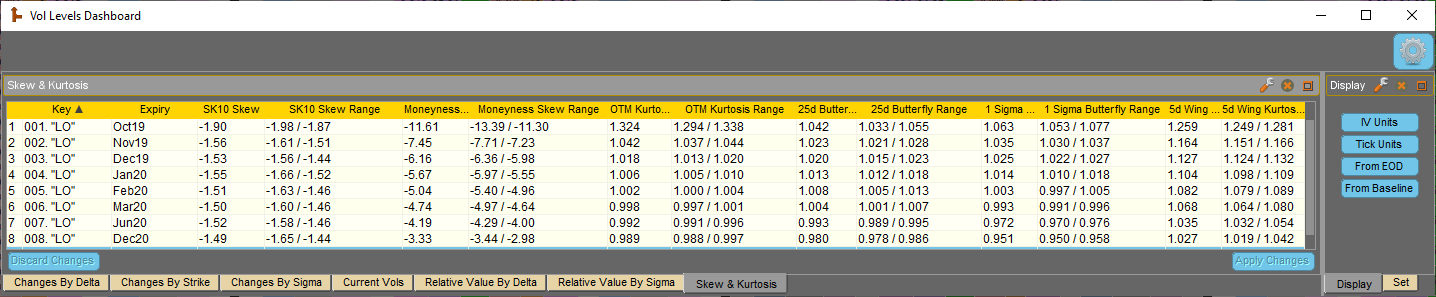
- “Skew & Kurtosis” grid displays sophisticated but widely used industry metrics to calculate the slope and curvature of an IV smile. The following IV spread measurements help capture and assess the dynamics of the IV surface (see PDF user manual for more details):
- “SK10 Skew”: SK10 = [(100% ATM Strike IV) – (90% Strike IV)] * √t
- “Moneyness Skew”: [(110% Strike IV) – (90% Strike IV)]
- “OTM Kurtosis”: [90% IV + 110% IV] / [2 * (100% [100% ATM strike] IV)]
- “25d Butterfly”: [25d call IV + 25d put IV] / [2 * (50d IV)]
- “1 Sigma Butterfly”: [1.0 sigma call IV + 1.0 sigma put IV] / [2 * (0 sigma (synthetic ATM strike) IV)]
- “5d Wing Kurtosis”: [5d call IV + 5d put IV] / [2 * (50d IV)]

The VolLevels™ Algo User Manual
Click here for a free trial
Evaluate individual smiles and the entire IV surface with the same advanced metrics utilized by the industry’s most sophisticated trading desks.
Closely monitor the nuanced behavior of your vol curves and IV surfaces…allowing you to quickly spot and exploit predictable market patterns.
Recognize market-manipulation and irrational curve pricing immediately, which prevents you from getting ‘suckered’ into losing trades.

Spot pricing anomalies and fleeting opportunities, faster than the competition.
Pair with the Dynamic Skew Algo to form a potent alpha-generating 1-2 punch.